
















 Reading time 13 minutes
Opening a market on Shopify is relatively simple. Whether that market creates value is another question. A shop can increase orders and revenue in a country while losing margin due to costly customer acquisition, discounts, returns, logistics, tools, content localisation and staff time that do not appear in the sales report.
When management focuses solely on sales, it risks rewarding volume and overlooking the real cost of sustaining it.
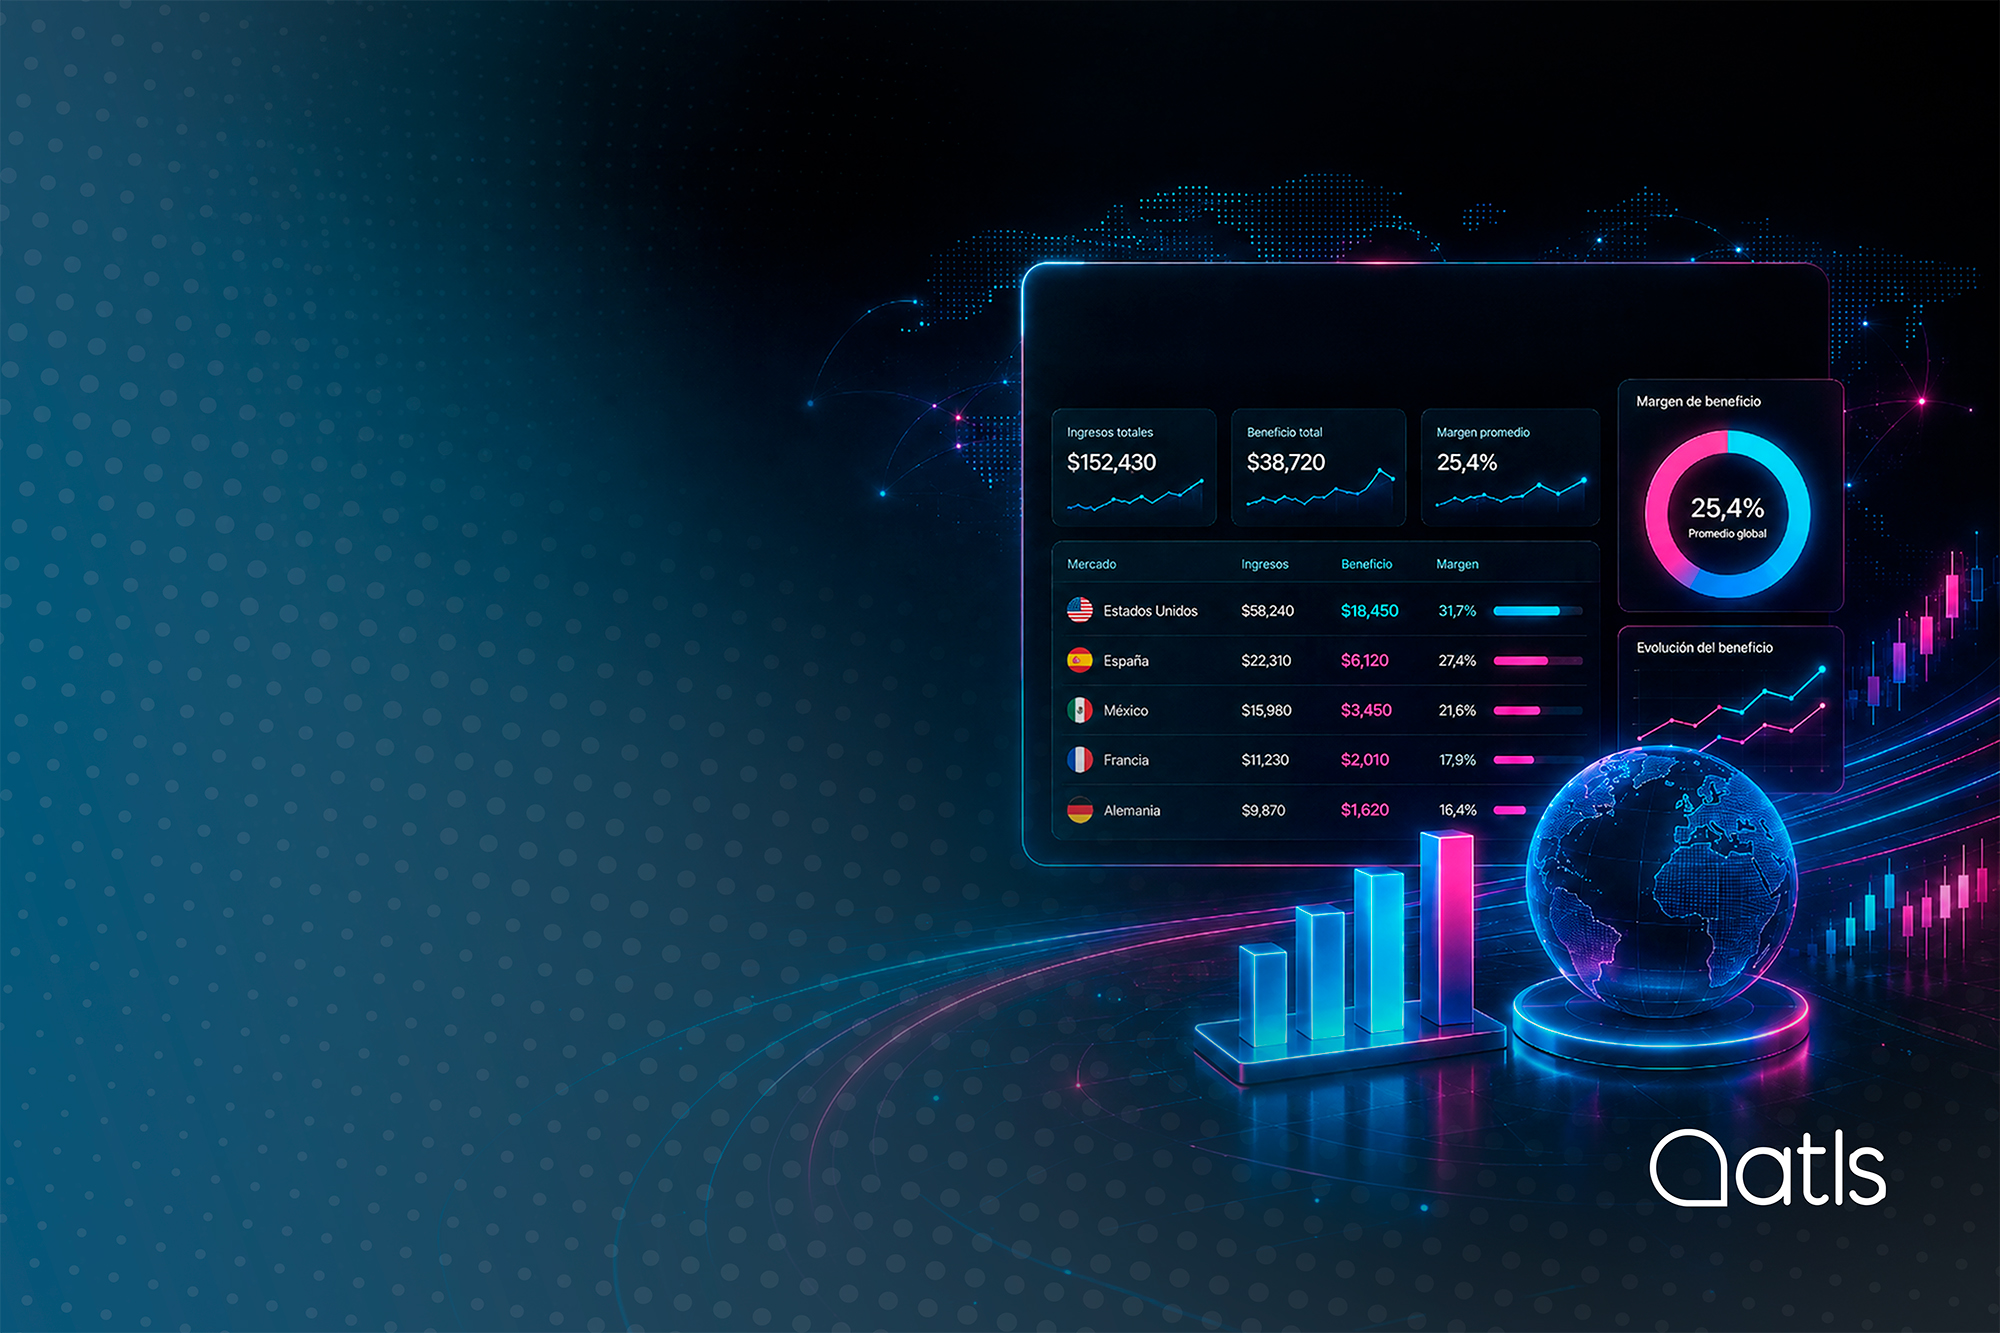
International Shopify analytics must therefore answer a more demanding question: what benefit does each market provide after considering all the resources needed to acquire, convert and retain customers?
The answer requires connecting Shopify data with marketing, SEO, catalogue, operations and technology. Only then is it possible to distinguish a market ready to scale from one that needs optimisation or a profound rethinking.

Why international Shopify analytics should focus on the margin
Gross sales, net sales and profitability are not the same thing. Gross sales show the initial value of orders. Net sales incorporate discounts, returns and adjustments. The margin adds another layer, because it deducts the cost of the product and the variable costs associated with serving that market. Even so, a comprehensive business view must also incorporate acquisition, content, technology and operations.
Let's look at an example. Market B generates 30% more sales than Market A, but has twice the return rate, requires more expensive campaigns and demands more support hours. If the dashboard is limited to revenue, Market B will appear to be the winner. When margin, customer acquisition costs and operational workload are factored in, the decision may be reversed.
A market is not profitable simply because it generates sales, but because it delivers sustainable growth after the costs of operating it have been covered.
The key is to allocate costs in a coherent manner. The translation and adaptation of product pages, catalogue corrections, integrations, local coordination, issues and reliance on the technical team all form part of the return.
Not all costs can be allocated with accounting precision, but they can be distributed using consistent criteria, such as hours worked, order volume, number of active products or technology usage.
What to measure with international Shopify analytics before scaling
Measurement starts before launch. A brand needs a baseline that brings together traffic from the target country, organic search queries, existing international orders, average order value, most-viewed products, internal searches and commercial enquiries. This snapshot makes it possible to determine whether there is existing demand or whether expansion will depend almost entirely on paid investment.
The next step is to formulate a growth hypothesis: which products will sell, to which audience, with what value proposition, expected margin, channels, investment and timeframe. It is also important to define what result would justify continuing. Without this threshold, any data can be interpreted in favour of the project. Effective measurement means agreeing in advance what success, warning signs and failure look like.
Objectives should be organised by phase. During validation, demand and qualified interest are the key metrics. During acquisition, the focus should be on cost and traffic quality. During conversion, product and checkout performance become the priority. During retention, repeat purchases and customer lifetime value matter most. Only then does it make sense to assess profitability and scaling.
This approach avoids demanding immediate profit from a market that is still being tested, while also preventing an initiative from continuing indefinitely without clear signs of progress.
KPIs that explain a market's true performance
A useful international dashboard combines leading indicators, which anticipate what may happen, with outcome indicators, which show the economic impact. Sessions, impressions and add-to-cart events help diagnose the customer journey. Margin, repeat purchases and operating costs confirm whether the system is generating value.
The main groups of indicators are:
- Acquisition: sessions, organic and paid traffic, impressions, CTR, cost per click, customer acquisition cost and branded searches.
- Conversion: add-to-cart events, checkout starts, conversion rate, abandonment rate, average order value and performance by product, device or source.
- Business: gross and net sales, discounts, returns, margin, orders, units per order and revenue per visitor.
- Retention: repeat purchases, returning customers, customer lifetime value and time to second order.
- Operations: manual hours, catalogue errors, issues, delivery times, support and logistics costs.
It is not necessary to show every metric to everyone. Management needs sales, margin, growth, investment and forecasts by country. Marketing needs to see traffic, organic demand, campaigns, customer acquisition costs and content contribution.
E-commerce teams need product, stock, conversion, checkout, average order value and returns. Operations should track publishing times, errors, issues and workflow status.

The common denominator is comparability. Definitions, time windows, currencies and attribution criteria must be consistent across countries. If one market measures new customers over 30 days and another over 90, or if logistics costs are allocated differently, the ranking will be misleading even if each figure is accurate on its own.
Currency normalisation deserves particular attention. For day-to-day management, the local currency can be retained, but management needs a common currency and the exchange rate applied. Otherwise, a currency fluctuation may be mistaken for growth. Taxes, tariffs and shipping costs should also be treated consistently.
It is also worth analysing cohorts by acquisition date and market. Two countries may show the same initial conversion rate but perform very differently six months later. If one generates more repeat purchases and requires fewer discounts, its value will be higher even if the first order delivers a lower margin.
How to leverage Shopify Analytics and ShopifyQL
Shopify provides reports for analysing sales, orders, products, customers and traffic from a unified environment. One of these is the average profit margin by market report, which brings together product, shipping, tariff and import tax metrics. For the calculation to be useful, the platform notes that the cost per item must have been recorded for the products and variants sold.
ShopifyQL extends these capabilities through queries focused on commerce data. It allows users to select metrics, group them by dimensions, filter results, compare periods and display them in tables or charts. In this context, International Shopify analytics can be used to build questions linked to business decisions: which country is improving its margin, which category converts best, which channel attracts higher-value customers or where returns are increasing.
The official ShopifyQL documentation also allows users to create custom explorations and use certain metafields as dimensions or filters when they are enabled for use in Analytics. This makes it possible to classify products, campaigns or processes according to specific criteria. However, agency, content, support and external technology costs may require an additional layer of integration.
Connecting international content, SEO and sales
Publishing a product page in another language does not guarantee relevance. Content may be available and yet fail to match local search intent, build trust or help customers make a decision. For this reason, content analytics should track which pages initiate purchases, which categories serve as entry points and which articles, comparisons or guides contribute to product discovery.

Every major update should record the date, market, URL, type of optimisation, target keywords and changes made. The subsequent analysis should track changes in visibility, qualified sessions, engagement, product visits, conversion and margin. Google Search Console allows performance to be segmented by queries, pages and countries, although its data should be interpreted with its aggregation and privacy limitations in mind.
This sequence does not establish absolute causality, as campaigns, seasonality, availability and pricing may also play a role, but it provides a much stronger basis for learning. It also allows different production models to be compared, such as replicated pages, content adapted using technology and specialised manual optimisation. The analysis should include production cost and time, keyword coverage, traffic, leads and sales.
The public Flabelus case study provides a practical reference. According to ATLS, automating its Shopify store enabled it to manage more than 1,500 products across four languages and gain more than 2,200 international keywords within three months. The figure is relevant because it connects operational efficiency with organic visibility, although each business must then measure how that coverage translates into demand, conversion and margin.
Measuring the return on connectors and automation
Automation is not justified simply because it saves time. Its return comes from reducing the cost of operating the business and improving commercial capacity. The first step is to calculate the manual process:
Number of pieces of content × markets × updates × average time × hourly cost
This baseline should then include reviews, corrections, imports, coordination, issues and technical support. The next step is to compare the situation before and after implementation. Working hours, time to launch, catalogue errors, outstanding updates, technical dependency and the number of markets managed per person provide an operational measure. The commercial impact can be seen in simultaneous launches, products available for sale, SEO coverage, international campaigns and reduced time to market.
A simple way to estimate the payback period is to divide the initial investment by the monthly operating savings plus incremental margin. In turn, return can be expressed as incremental profit minus the investment, divided by the investment.
It is important not to treat the estimate as an automatic promise. Some of the margin may result from other factors, and savings are only real if the time freed up is eliminated or redirected towards higher-value activities. This means ROI should be reviewed using actual data after implementation and compared against the initial hypothesis.
Building an international dashboard focused on decision-making
For International Shopify analytics to be useful, the dashboard should support decision-making rather than simply bringing together charts and metrics without a clear hierarchy. The main view should compare countries and show net sales, contribution margin, customer acquisition cost, repeat purchases, returns and operating costs. Below this, each team needs a diagnostic view that explains why a metric is improving or declining.

It is worth incorporating targets and thresholds. Colours and alerts should not simply flag that a metric has fallen, but that it has moved away from the target agreed for its stage.
It is also useful to include business annotations and a change log. When a decline coincides with a stockout or an increase in logistics costs, the team can act quickly.
When a change coincides with a content optimisation, the team can decide whether to apply the learning to other markets.
Frequency matters as much as design. Operational indicators can be reviewed weekly, while margin, repeat purchases and return on investment require monthly or quarterly timeframes. Comparing a low-volume market on a daily basis creates noise. The solution is to adapt the frequency to the buying cycle and sample size.
Deciding whether to scale, optimise or stop a market
Scaling makes sense when margin is positive, conversion is improving, customer acquisition costs are sustainable, repeat purchases are increasing and operations remain stable. In that scenario, additional investment should be directed towards the channels, categories and content that are already showing traction, without assuming that the entire catalogue will perform in the same way.
Optimisation is the right option when there is demand but the system is losing efficiency. A country with high traffic and low conversion may need better local adaptation, payment methods or a stronger value proposition. A market with strong sales and high return rates calls for a review of the product, customer expectations and logistics. If there is strong organic visibility but little product engagement, the issue may lie with search intent or internal linking.
Stopping or reassessing a market does not mean failure. It is a rational decision when demand is insufficient, margins remain structurally negative, logistics costs are unviable or there are regulatory and operational barriers that are difficult to overcome.
The upshot is clear: Mature analytics does not only identify opportunities. It also protects resources by showing where continued investment is not worthwhile.
How ATLS can help improve international profitability
ATLS approaches profitability as a system, rather than as an isolated report. The work begins with a market audit and the definition of comparable KPIs. It continues with the SEO and content analysis, catalogue review and Shopify integration. From there, connectors, automation and dashboards reduce manual tasks and make the relationships between actions and outcomes visible.
This approach makes it possible to act on variables that often fall outside commercial analysis: publishing speed, data quality, catalogue consistency, organic coverage and adaptation costs. Technology provides the infrastructure, but the advantage comes from the judgement used to design the model and turn findings into priorities.
Discover which markets are generating real growth. At ATLS, we analyse data, content and processes to turn Shopify into a more profitable, measurable and scalable international operation.
Frequently asked questions about international Shopify analytics
What is international Shopify analytics?
It is the comparative analysis of sales, margin, acquisition, conversion, repeat purchases and operating costs across each market managed through Shopify.
What KPIs should international Shopify analytics include?
It should include net sales, margin, conversion rate, average order value, CAC, repeat purchases, returns, organic traffic, logistics costs and operational hours.
How does international Shopify analytics help compare countries?
It applies consistent definitions, time periods, currencies and attribution criteria to identify which markets create value and which need adjustments.
Can international Shopify analytics measure content and SEO?
Yes. It allows pages, keywords, traffic and optimisation dates to be linked to product engagement, conversion, sales and margin.
How does international Shopify analytics measure the ROI of a connector?
It compares the investment with hours saved, fewer errors, faster launches and the incremental margin generated.